

Drone mapping and more Everything between the photo and the map.
Alongside surveys and systems, we take on focused jobs that municipalities and organisations need from time to time: drone photography and mapping, 3D models, digitisation and conversion of plans, maps for display and print, and sorting out data that has piled up in different formats.
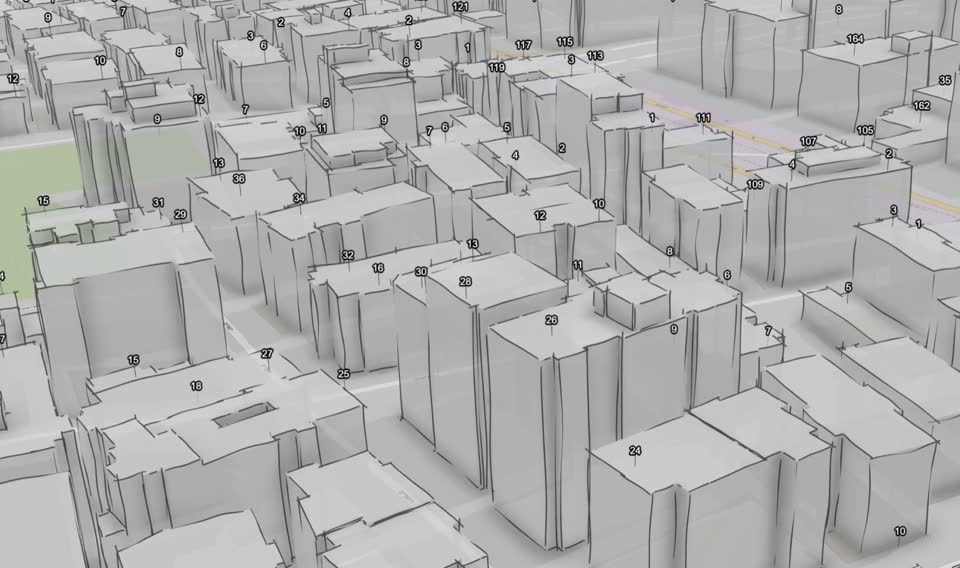
The services
Five jobs best left to people who do GIS every day
-
Drone photography and mapping
Aerial photos and video, orthophoto and elevation model for a focused area.
-
3D models
City scenes, buildings with heights and line-of-sight analysis.
-
Digitisation and compilation
CAD drawings, scanned plans and building files, into GIS layers.
-
Maps for display and print
Wall maps, meeting maps and maps printed on fabric.
-
Data processing and conversion
Address cleansing, format conversion and coordinate-system fixes.
Drone
Drone photography and mapping
A drone is the right tool when you need a current view of a defined area, quickly, and at higher resolution than standard aerial imagery: a construction site, a new neighbourhood, a planning area or an event that needs recording.
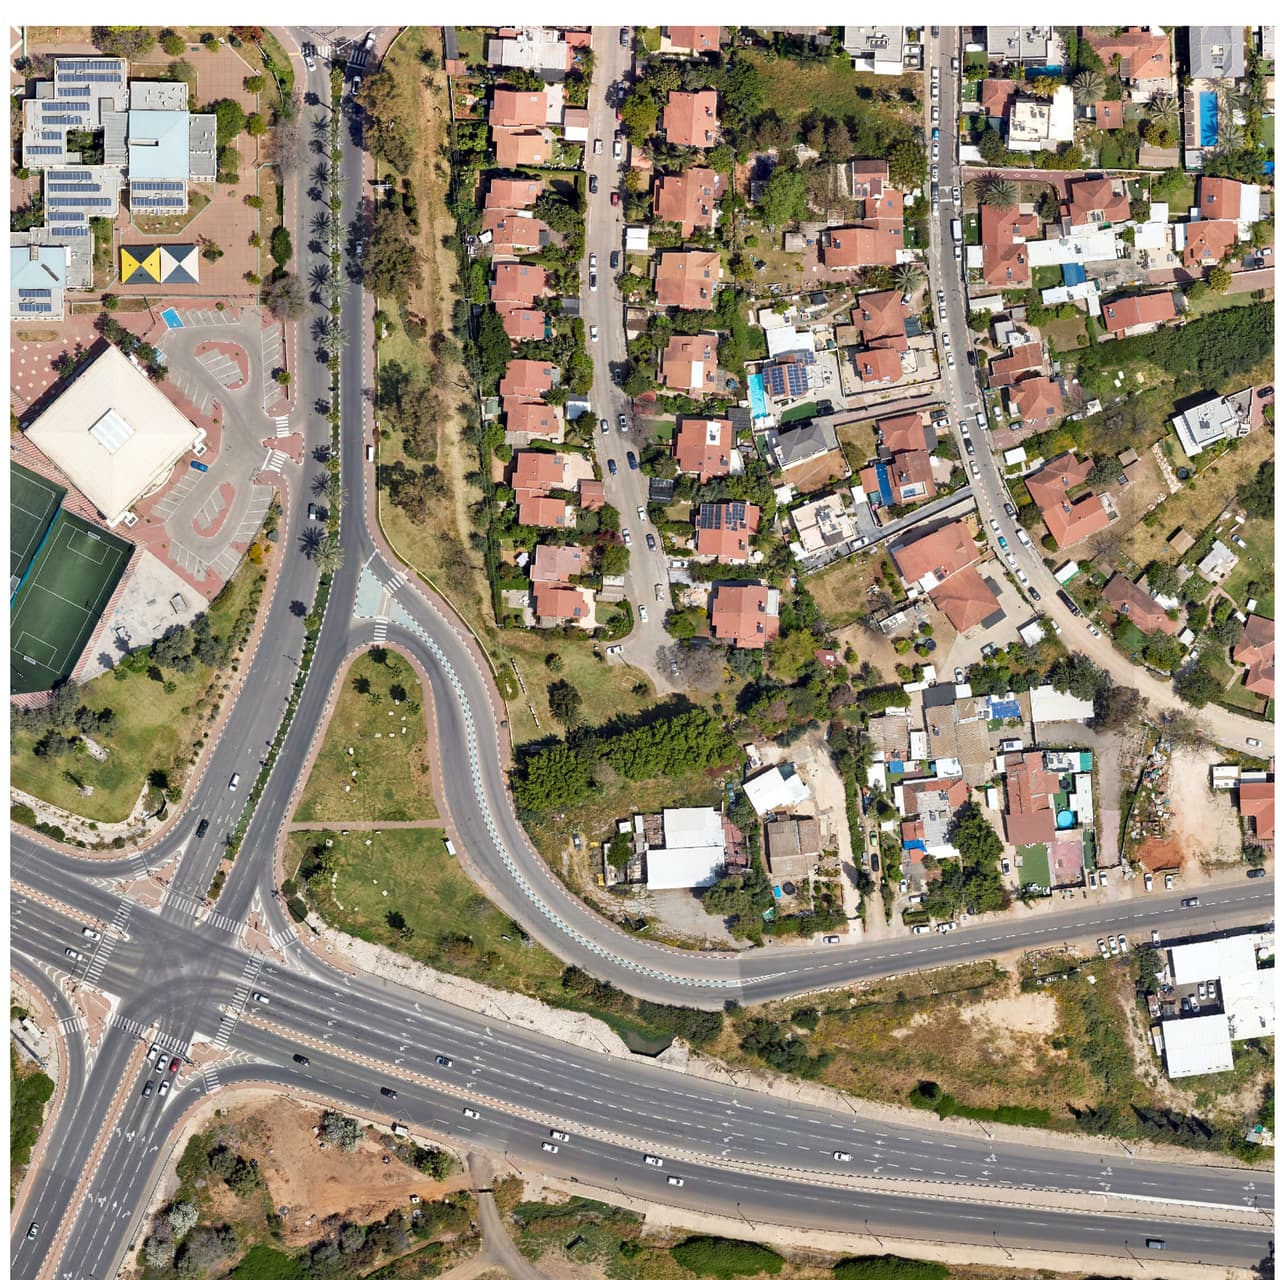
Need GIS layers from the imagery? That is an orthophoto survey.
-
Aerial photos and video
Images and footage for documentation, presentations and project marketing.
-
Orthophoto and elevation model
A calibrated orthophoto in the Israeli grid and a surface model for a focused area, as a basis for mapping and on-map measurement.
-
Progress monitoring
Repeat flights over the same site, to compare states over time.
-
Oblique imagery
Angled imagery showing facades, storeys and balconies that are invisible from directly above.
3D
3D models
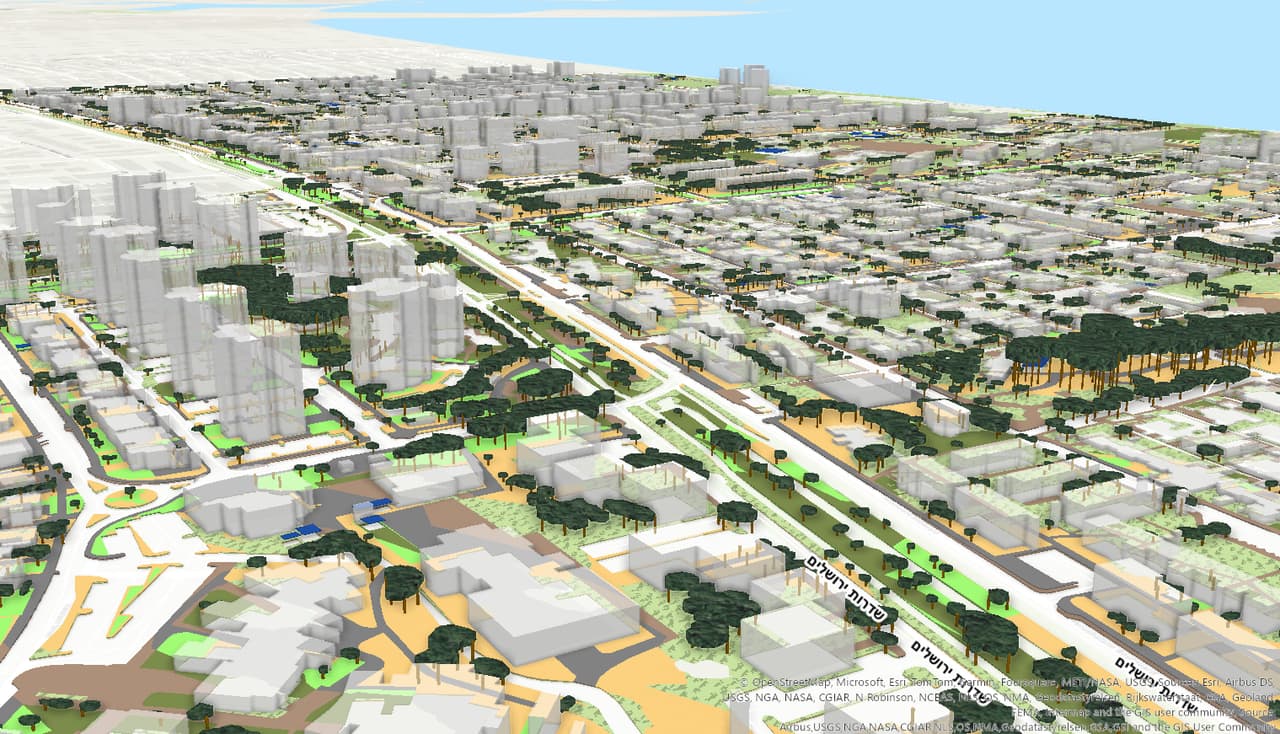
3D turns a plan into something you understand at a glance: how a building will look, what can be seen from a hill, and where a height restriction runs.
-
City scene
Buildings with heights derived from orthophoto layers and a surface model, in a scene you can share and bring into your GIS.
-
Line of sight and viewshed
Analysis of what is visible from a given point and what is hidden, based on a surface model.
-
Height restrictions
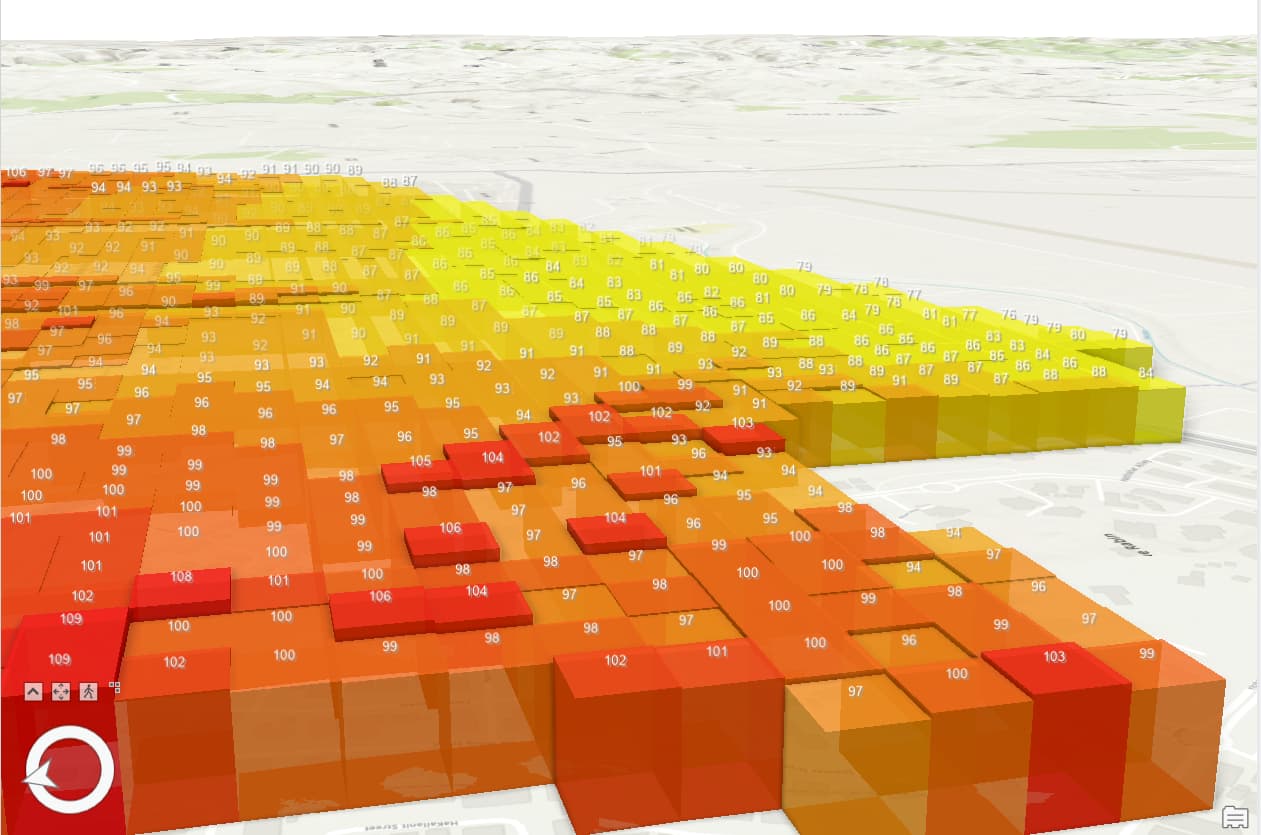
A permitted-height grid, for example around airports, displayed over the city model.
-
Planning visualisation
Existing versus proposed conditions for committees, residents and decision makers.
Digitisation
Digitisation and compilation of plans
Much of a municipality's knowledge sits in AutoCAD files, scanned plans and building files. Digitisation turns it into layers you can search, clip and show on the map.
-
CAD to GIS
DWG and DXF files converted into GIS layers. For recurring conversions, such as statutory plans under the MAVAT procedure and AS-MADE surveys, we built a dedicated product: CADabra.
-
Scanned plans and building files
Scanning, georeferencing and digitising old plans and building files, into a layer linked to the original document.
-
Scanned maps to layers
Text and features extracted from scanned maps with OCR, and placed in the coordinate system.
-
Compilation
Plans from different sources merged into one plans layer, with boundaries, land-use designations and links to documents.
Cartography
Maps for display and print
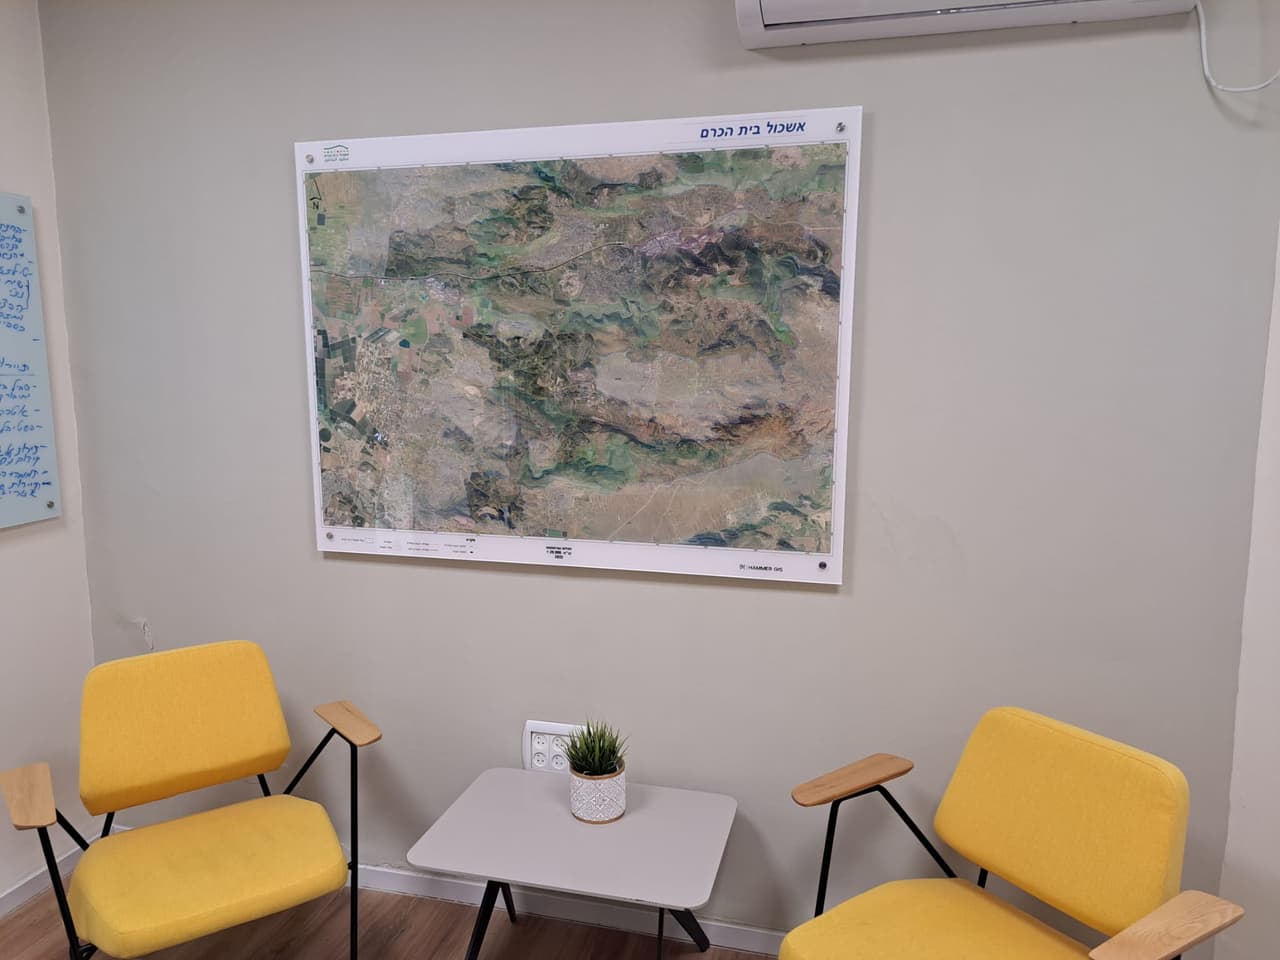
A good map on the meeting-room wall does something a screen does not: everyone sees the same picture, at the same size, every day.
-
Wall maps
Large maps for municipal offices: addresses, blocks and parcels, neighbourhoods and infrastructure.
-
Maps for meetings and committees
Thematic maps that show one topic clearly, for a management meeting, a committee or a resident presentation.
-
Fabric maps
Printing on fabric, for maps that need to last or serve as a gift or event piece.
-
Maps for publication
Clean maps for brochures, presentations and websites, designed to match the organisation's branding.
Data
Data processing, conversion and cleanup
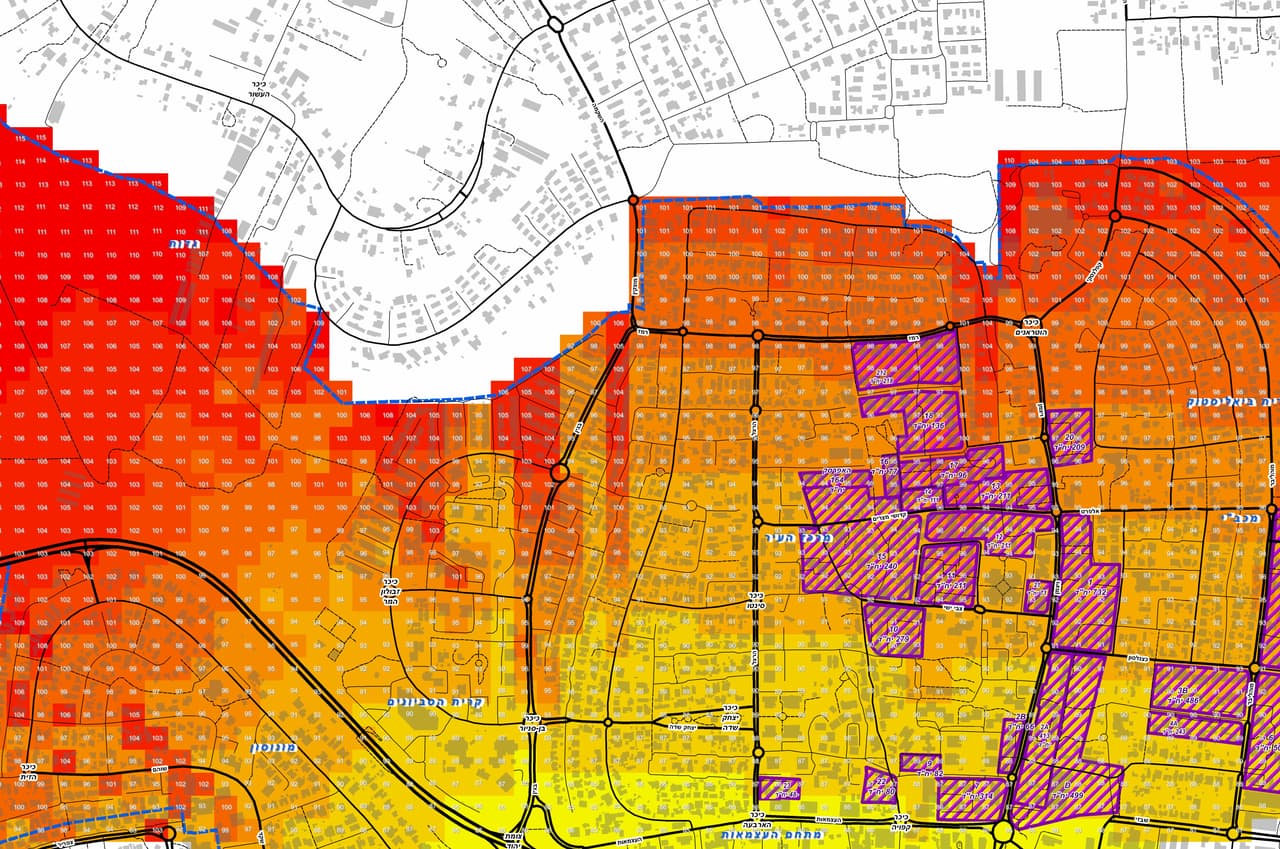
A layer that will not line up, an address table that will not join to the map, or five files describing the same thing in five ways. Fix it once, properly.
-
Address cleansing
Street names and house numbers standardised, gaps filled and the table joined to the address layer.
-
From table to map
Excel tables with addresses or coordinates turned into a GIS layer.
-
Format conversion
Shapefile, File Geodatabase, GeoPackage, GeoJSON, KML and DWG/DXF, in any direction, without losing attributes.
-
Coordinate systems
Diagnosing and fixing layers that do not line up: Israeli Transverse Mercator (ITM), the old Israeli grid and WGS84, with the correct transformation between them.
-
Merging and QA
Schemas and domains unified, duplicates removed, topology fixed, and checks before publication.
-
Publishing
Orderly loading into ArcGIS Online, with symbology, pop-ups and defined sharing.
FAQ
Questions about additional services
What is the difference between drone imagery and an orthophoto survey?
Drone imagery provides photos, video or an orthophoto of a given area. An orthophoto survey is the next step: interpreting the imagery into GIS layers such as buildings, pavements and poles. You can order either one separately, or both together.
Are drone flights authorised?
Yes. Flights follow Civil Aviation Authority of Israel regulations and are coordinated with the relevant parties in the flight area, with care for privacy. Airspace restrictions are checked before every project.
Can AutoCAD files be converted into GIS layers?
Yes. For a one-off or unusual conversion we do the work as a service. For recurring conversions, such as MAVAT plans and AS-MADE surveys, CADabra handles it with topology checks, a quality report and publishing to ArcGIS Online.
Our layers do not line up. Can you fix that?
Yes. Usually a layer was assigned the wrong coordinate system, or converted without the right transformation, for example between the old and new Israeli grids. We diagnose the cause, fix it and document what was done.
We have an Excel table of addresses. Can it become a map?
Yes. We clean and standardise the addresses, join them to the address layer or geocode them, and deliver a GIS layer. Addresses that cannot be matched are listed separately for review.
Do you produce wall maps?
Yes. We design and produce large-format wall maps for municipal and corporate offices, from your data and in your branding, as well as maps printed on fabric.
Can we get a 3D model of the city?
Yes, at different levels of detail. A basic model is built from buildings with heights derived from the orthophoto and a surface model. Line-of-sight analysis, height restrictions and planning visualisations can be added on top.
Got a file, plan or image waiting for a map?
Send us a sample and a short description, and we will come back with a proposal for the work and the deliverable.