

Municipal surveys From the ground to the layer. From the layer to the decision.
A good survey is the basis for a decision, not another file in a drawer. We plan every survey around the question your organisation needs answered, capture data from the air, from a vehicle and on foot, check every feature, and deliver GIS layers that are ready to use in your own system.
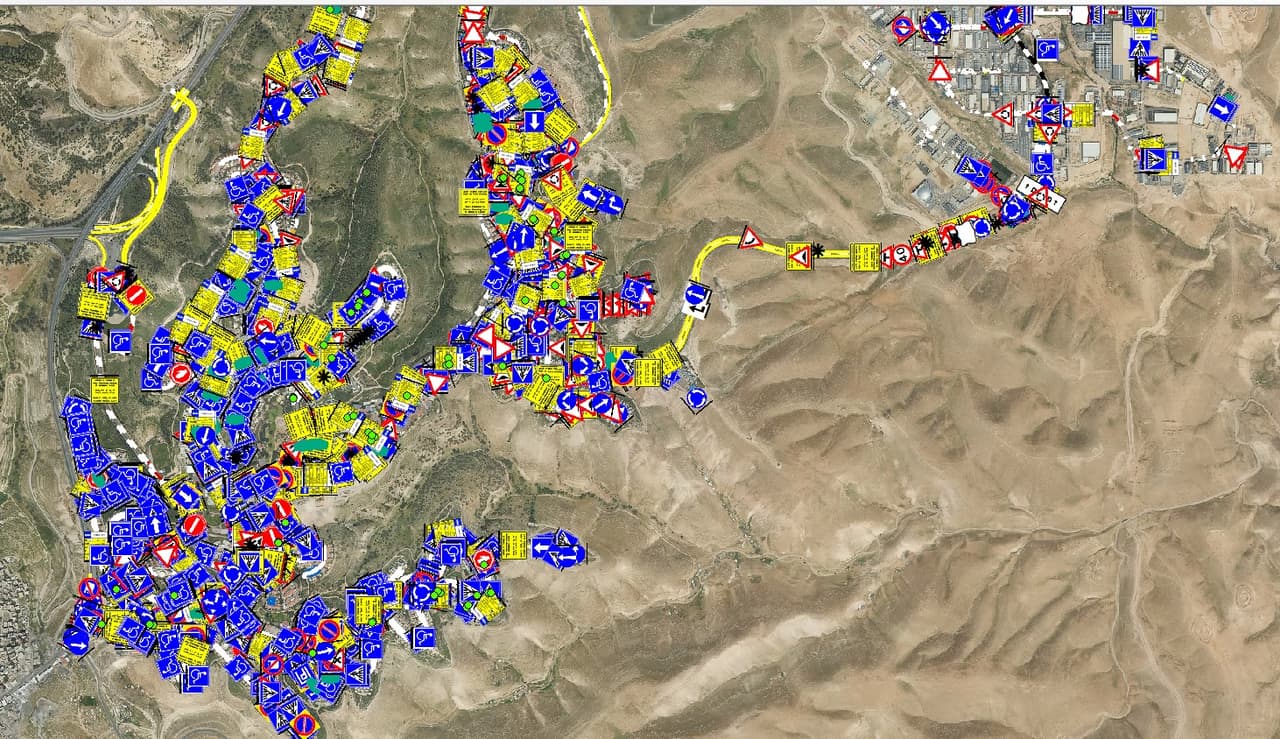
Why survey
Data first, then the decision
A field survey is the systematic capture of features in space, such as traffic signs, manholes, trees and facilities, each with a location, attributes and a photo, stored as GIS layers you can work with.
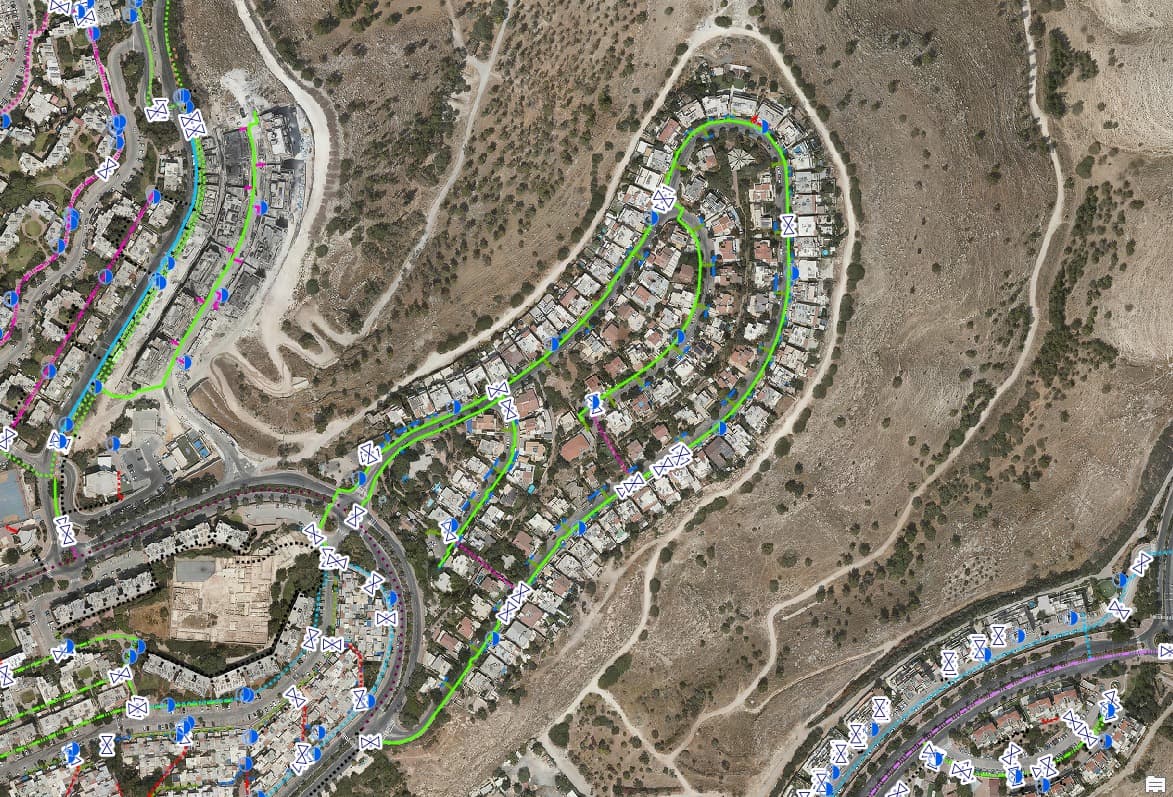
In most municipalities, spatial data has piled up over years, from different sources and different hands. Layers are often out of date, their accuracy is unknown and nobody can say when they were last checked. A survey restores certainty: what is there, where, in what condition and according to which source. From then on, a maintenance budget, a work plan or a committee decision rests on the ground itself.
-
Budgets based on real conditions
Prioritise maintenance and investment by what is actually on the ground, not by old drawings or call-centre complaints.
-
Meeting statutory duties
Orderly records for the local traffic authority, public-space accessibility and mature-tree management.
-
One map for every department
Engineering, operations, revenue and emergency teams work from the same layer, in the same version.
How it works
Five stations from the field to your system
Every survey follows the same route, from planning to the layer that lands in your system.
-
Planning
Together we define the purpose, the feature list and attribute table, the accuracy requirement for each layer, the capture method and the delivery format. We check what already exists so nothing is surveyed twice.
-
Field capture
The tool follows the feature: aerial imagery and drones for areas and rooftops, camera vehicles for streets, and surveyors on foot with mobile apps for details you only see up close. Every record is stored with a location, a photo and a date.
-
Quality control
Automated detection speeds up the work, but it does not decide on its own. Specialists check location, classification, completeness and attributes. Exceptions are logged, not buried.
-
GIS layers
Data is built as point, line and polygon layers with domains, codes and linked photos, in the Israeli Transverse Mercator grid (ITM).
-
Delivery
Layers are loaded into your ArcGIS Online, into HAMMER CITY or into another system, with GIS, DWG, Excel and PDF files as needed, and a survey report that explains what was captured and how.
Survey types
A survey for every layer of the city
Each survey stands on its own, and several can share one capture campaign.
-
Orthophoto survey
Aerial imagery interpreted into GIS layers: buildings, pavements, poles, manholes, signs and trees, with AI and human QA.
-
Infrastructure survey
Drainage, street lighting and water: every inlet, manhole, pole and meter, with attributes and a photo.
-
Traffic-sign survey
Signs, poles and road markings, captured by vehicle with AI detection and a human check on every sign.
-
Hazards and accessibility
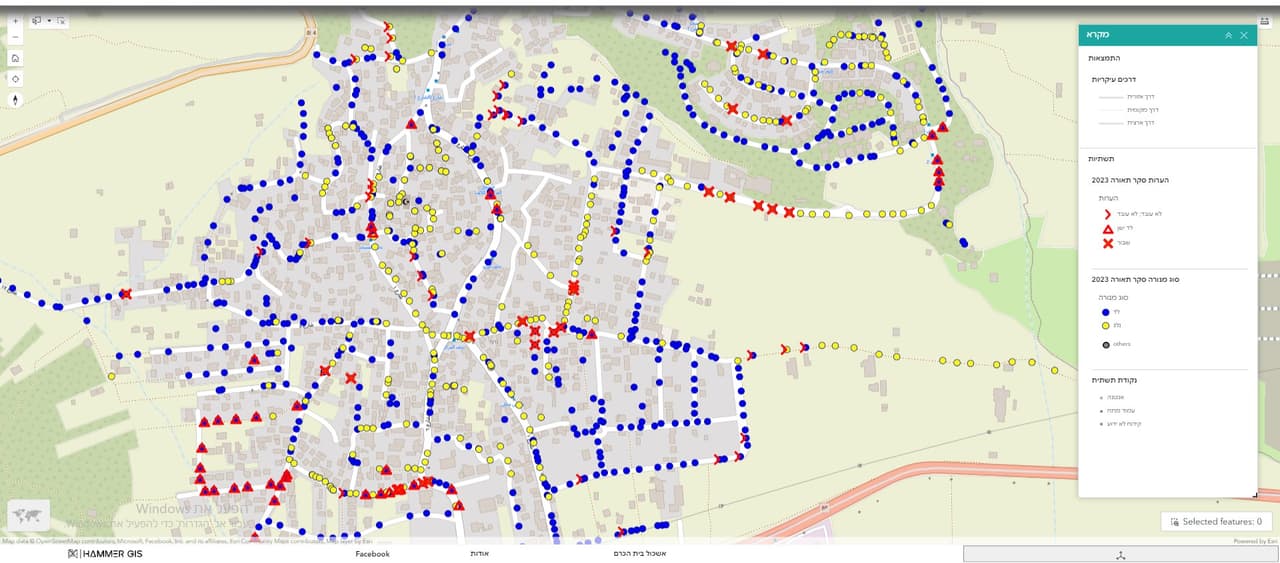
Hazards, obstructions and accessibility in public space, with a photo and severity for every finding.
-
Trees and green spaces
Trees, canopies, planted areas and irrigation meters, for pruning, irrigation and shade planning.
-
Public assets and facilities
Public buildings, plots, playgrounds, street furniture and cemeteries, linked to leases and allocations.
Capture methods
Three ways to capture a city
No single tool fits every feature. We combine methods according to what needs to be seen, and how precisely.
-
From the air
A current orthophoto from your organisation or an aerial-imagery provider, drone imagery for focused areas, and oblique imagery when facades, storeys and balconies matter.
-
From a vehicle
A vehicle with panoramic cameras and AI detection covers whole streets and keeps an image for every stretch. Suited to traffic signs, road markings and hazards.
-
On foot
Surveyors with mobile capture apps such as Survey123 and Field Maps, using forms with fixed value lists. Suited to trees, light poles and facilities that need a close look.
Deliverables
What you get at the end
-
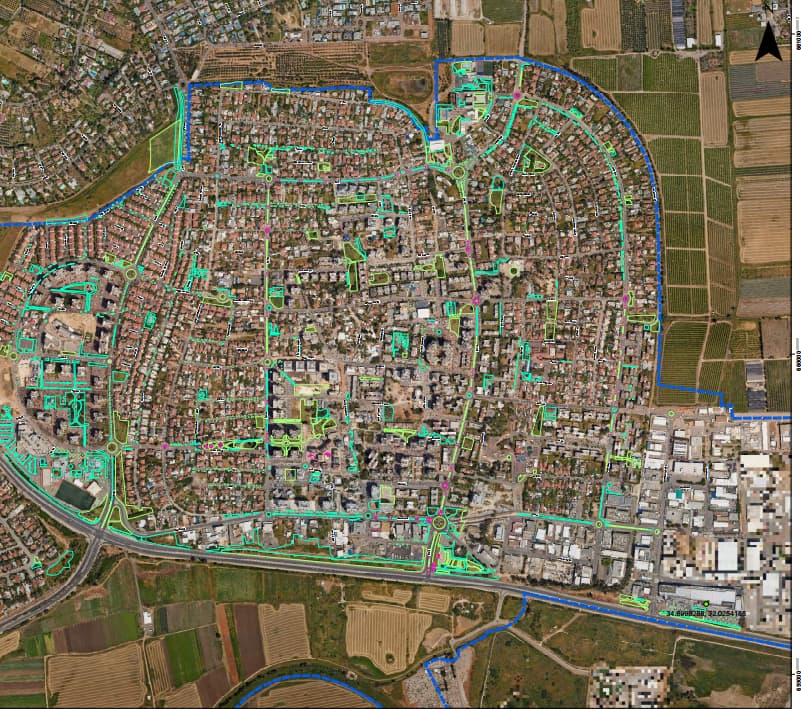
GIS layers
Point, line and polygon layers in the Israeli Transverse Mercator grid (ITM, EPSG:2039), in the format your system uses.
-
Attributes
A clean table with domains and codes, for example the Ministry of Transport sign code or the CBS street code, and a unique ID for every feature.
-
Photos
A photo linked to every feature. Vehicle surveys also hand over all street imagery for the organisation's ongoing use.
-
Reports and maps
A survey report, Excel tables and PDF maps for presentations, meetings and approvals.
-
Metadata
For every layer: source, date, coordinate system, capture method and the accuracy requirement agreed in advance.
Accuracy and QA
Accuracy defined up front, not promised after the fact
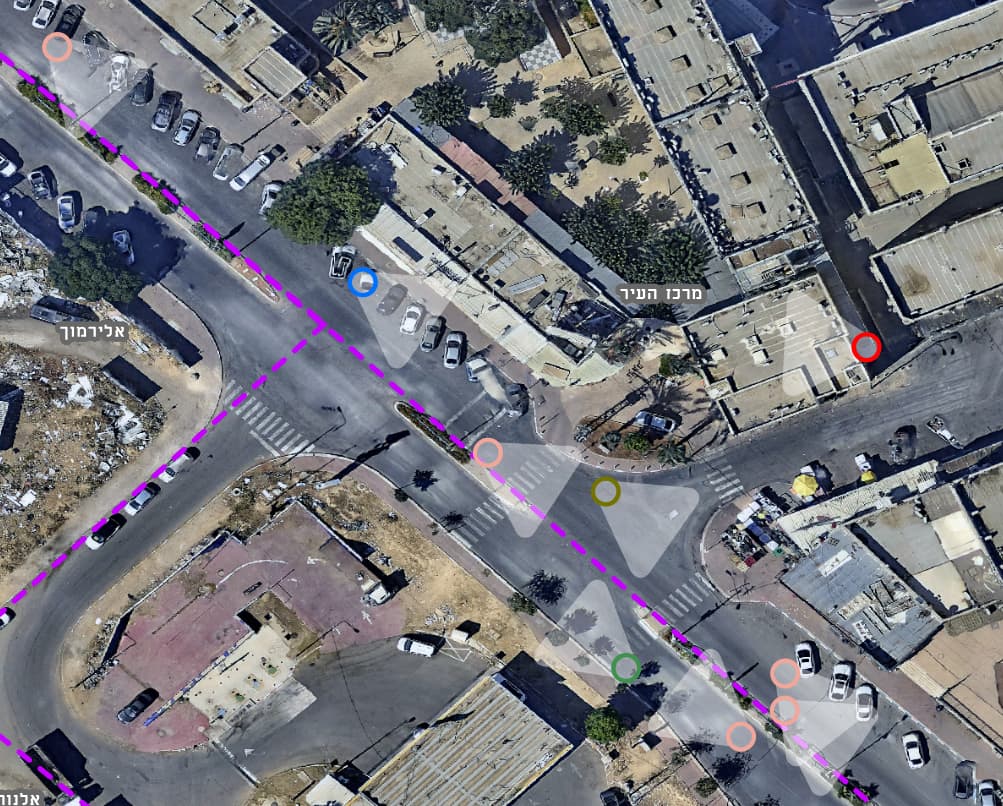
You will not find a blanket accuracy figure here, because there is no such thing. Accuracy depends on the source and the method: the orthophoto's resolution and capture date, the field equipment and the site conditions. So for every survey we set the accuracy requirement per layer, the source the positions rely on and the way they are checked, and we document all of it in the delivery report.
When a task calls for a measurement signed by a licensed surveyor, for example for engineering design or a statutory document, we say so at the planning stage. A GIS survey does not replace it.
-
A person checks every feature
AI detects and classifies; specialists confirm, complete and correct.
-
Exceptions are flagged
A feature that cannot be verified is marked as such in the layer and the report. It does not disappear.
-
Metadata on every layer
Source, date, CRS and method, so it stays clear years later what the layer is based on.
-
Your data
Layers and photos are handed over in open formats and remain the organisation's property.
Focused surveys
More questions a survey can answer
-
Building-change survey
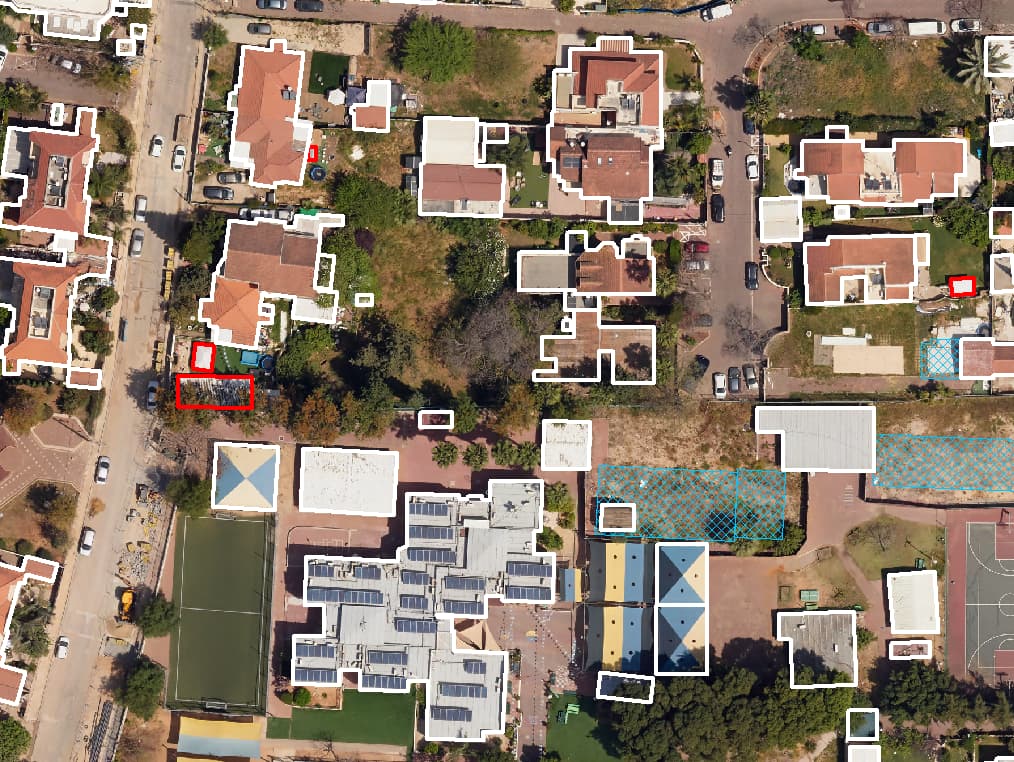
Two aerial images from different dates are compared to find buildings that grew or appeared, with oblique imagery for added storeys and balconies. The result is a findings list for building inspection, optionally cross-checked against permits.
-
Rooftop solar potential
Net free roof area for every building, excluding water heaters, open balconies and roofs facing away from the sun.
-
Urban heat islands
Street-level mapping of canopies, shade structures, surface materials and heights, to prioritise shading and planting. CLIMYX, the dedicated product, is at concept stage.
-
Building footprints
Closed building polygons by building ID, with heights from a 3D model where one exists.
FAQ
What people ask us about surveys
What is the difference between a GIS field survey and a land survey?
A GIS survey locates and records features, with position, attributes and a photo, for inventory, management and planning. A licensed surveyor's measurement provides engineering-grade position and height with a professional signature, and is required for detailed design and statutory documents. When a task needs that, we say so up front.
How is a survey's accuracy determined?
By the purpose and the source. At planning we set, for each layer, the accuracy requirement, the source positions rely on, such as an orthophoto of a given resolution or field capture, and how it is checked. All of this is recorded in the delivery report and the layer metadata.
Which coordinate system and formats do you deliver?
The default is the Israeli Transverse Mercator grid (ITM, EPSG:2039). Layers are delivered as File Geodatabase or Shapefile, or loaded straight into ArcGIS Online, and as DWG, Excel and PDF where needed.
Will the results go into our existing GIS?
Yes. We load the layers into your ArcGIS Online, into the maps and apps you already use, or into HAMMER CITY. If you run another system, we deliver in a format it accepts.
Can we start with a small area?
Yes, and it is often the best way to start. A pilot in one neighbourhood or along a main street lets you check the layers, attributes and system integration before scaling to the whole municipality.
What role does AI play in your surveys?
AI detects and classifies features in vehicle and aerial imagery, which shortens the work. It does not decide on its own: every detection is checked by a specialist, anything the model missed is added by hand, and positions are verified before delivery.
How often should a survey be updated?
It depends on how fast things change. Signs, assets and trees change constantly, so it pays to build an update path next to the survey, such as a field update form for staff. Layers derived from aerial imagery are naturally refreshed with each new orthophoto.
What do you want to survey?
Tell us which decision is in front of you, and we will propose the survey that answers it: scope, method, layers and delivery.