

Hazard and accessibility survey Public space, seen at the eye level of the people who use it.
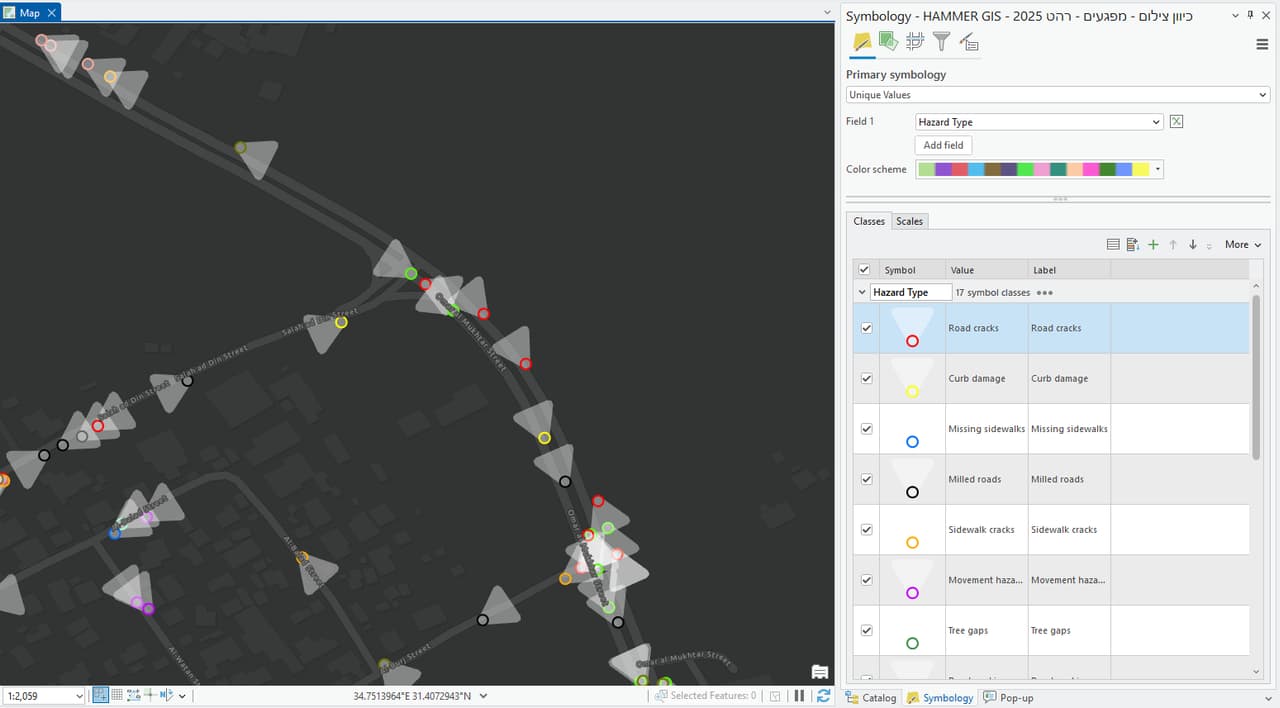
A hazard and accessibility survey maps what endangers or blocks pedestrians: broken pavements, obstructions, blocked sightlines, missing kerb ramps and inaccessible crossings. Each finding is a point on the map with a photo, type and severity, so repairs can be prioritised by risk, not by whoever called the hotline last.
What it is
A map of risks before they become incidents
A hazard and accessibility survey is the systematic detection and recording of safety hazards and accessibility defects in public space, each with a precise location, photo, type and severity, stored as a GIS layer.
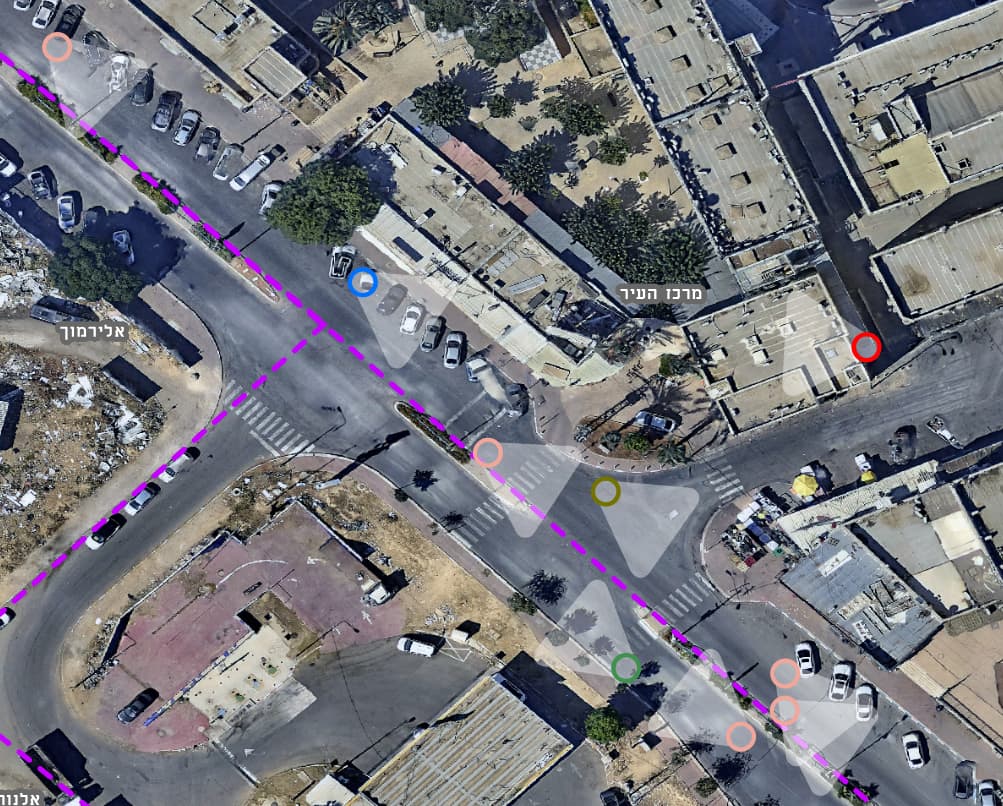
Hotline calls come from places where residents complain, not necessarily from the most dangerous spots. A systematic survey covers every street with the same method, giving engineering and maintenance teams a consistent picture to build a work plan and a budget from.
What we map
A findings catalogue agreed with you
-
Infrastructure defects
Broken pavements and kerbs, missing or sunken covers, potholes and subsidence.
-
Obstructions
Poles, signs, street furniture and vegetation that narrow the walking width of the pavement.
-
Blocked sightlines
Vegetation, signs and structures that block visibility at junctions and crossings.
-
Accessibility
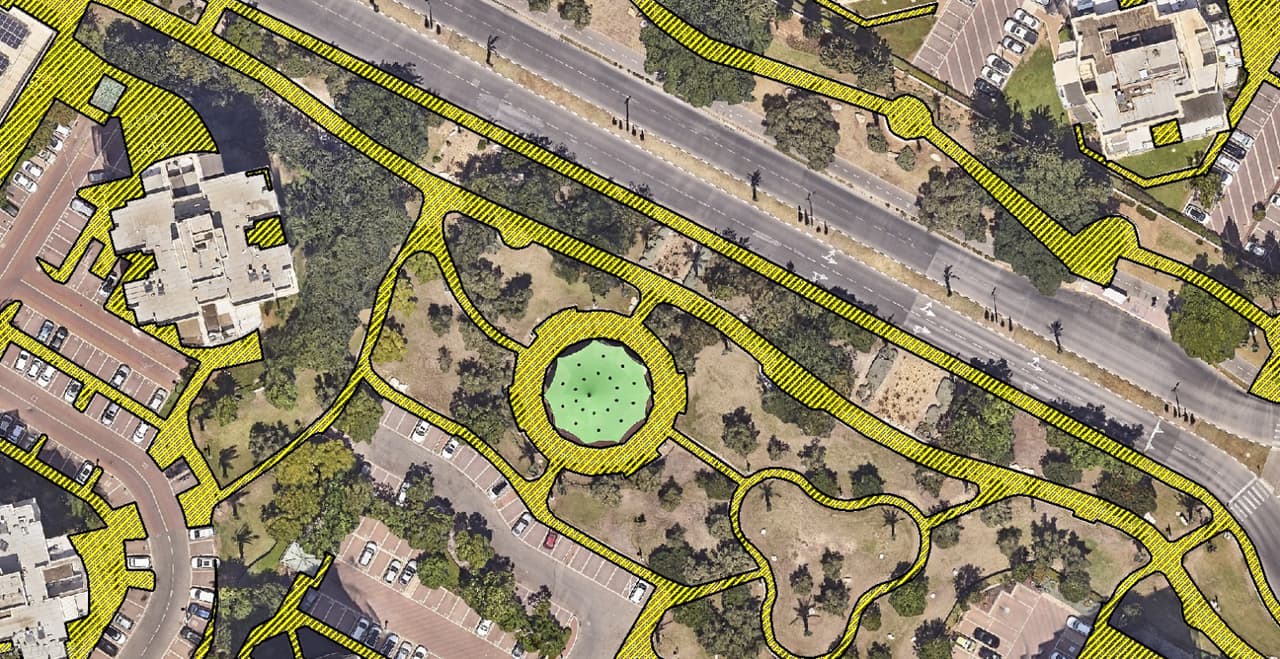
Kerb ramps, pedestrian crossings, junction accessibility, bus stops and disabled parking bays.
-
Custom findings
Any other finding type you want to track, with its own fields and severity levels.
How it works
From the street to a prioritised repair list
-
Definition
Together we set the findings catalogue, severity levels and priority zones, such as the surroundings of schools and public buildings.
-
Capture
A camera vehicle with AI detection covers the streets, and surveyors on foot complete pavements, paths and crossings the vehicle cannot see.
-
Verification
A specialist checks every finding: type, severity and location. Duplicates are merged.
-
Layers
A findings layer with photo, type and severity, alongside accessibility layers from the orthophoto, such as crossings and junction accessibility.
-
Delivery
A map and dashboard for prioritisation, a findings report, and a status field to track repairs.
What it gives you
From finding to action
-
Risk-based priorities
A repair plan that starts with the most severe hazards and the most sensitive areas.
-
Records and tracking
Every finding has a photo, a date and a status, so you can show what was found, when, and what was fixed.
-
Accessibility planning
A full picture of kerb ramps, crossings and stops, as the basis for a multi-year accessibility plan.
-
Lower exposure
Hazards found before they cause a fall or an accident.
Good to know
A GIS survey, not an accessibility certification
The survey maps and records public space and gives you a data foundation for planning. It does not replace an inspection or opinion by a licensed accessibility consultant where the law and regulations require one. The survey layers also serve that consultant as a mapped basis for their work.
FAQ
Questions about hazard and accessibility surveys
What is a public-space accessibility survey?
Mapping of pavements, kerb ramps, crossings, junctions, bus stops and disabled bays, and recording of defects that hinder people with disabilities, parents with prams and older residents. Findings appear on a map with photo and severity and are used to prioritise accessibility works.
What is the difference between a hazard survey and an accessibility survey?
A hazard survey focuses on safety risks, such as a broken pavement or a missing cover. An accessibility survey focuses on the ability to move through space, such as a missing kerb ramp or a blocked path. Usually both are combined in one capture, since it is the same street and the same camera.
Does the survey replace a licensed accessibility consultant?
No. The survey maps and records, and provides a data basis for planning. Where the law or regulations require an inspection or opinion by a licensed accessibility consultant, it is done by that professional, and the survey layers can support their work.
How is hazard severity set?
Severity levels are agreed with you before the survey starts, based on the type, size and location of the hazard, for example near a school versus on a side street. Every finding is classified by the same rules, so streets and neighbourhoods can be compared.
Are hazards found by vehicle or on foot?
Both. A camera vehicle with AI detection covers the streets quickly, and surveyors on foot complete narrow pavements, paths and places the vehicle cannot see. Every finding, from any source, is verified by a person.
What happens to the findings after delivery?
Findings are delivered as a layer in your GIS, with a prioritisation dashboard and a status field. Maintenance teams update the status as each hazard is fixed, so the map remains a current picture.
Where is it least safe to walk in your town?
Start around schools, in the town centre or across every street. We will build the findings catalogue and capture method together.